
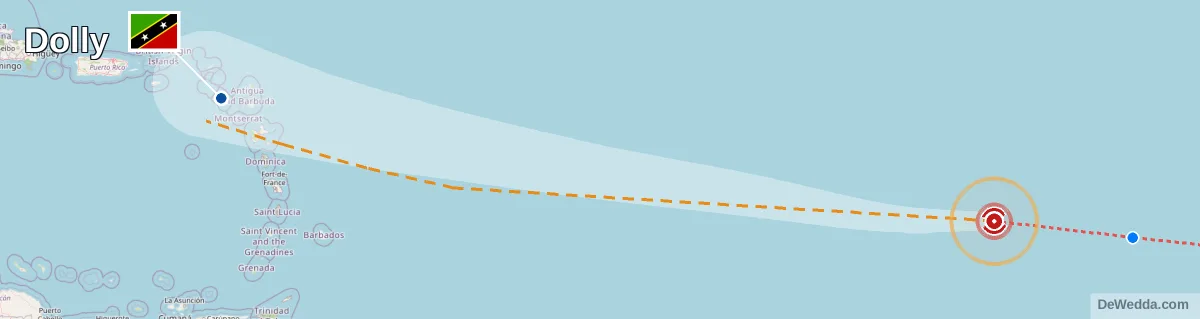
DeWedda.com turned one year old on August 6th, 2026. It launched with 14 islands, hourly conditions, storm distances and a map, and the first system it ever tracked was Tropical Storm Erin. This past week after hundreds of improvements over the past year, its first test of the season, the remnants of Dolly, by then tracked as tropical wave AL97, came straight through the Leewards, with a few squalls and some wind gusts.
I want to write about this week honestly, because it taught me something I already half knew. You can build a data driven website to work. You can test it against last year’s storms to make every page behave. But you cannot fine-tune it until the weather is actually happening, in real time, while people on the islands are looking at it.
What Dolly showed us, first as a storm and then as wave AL97
On Sunday morning, while sleeping in past 6 AM, the site said the wind in St. Kitts was 8 mph while a branch on my coconut tree outside came down. The number was not wrong, well not exactly. It was the hourly reading from our forecast provider, taken between two squalls. It was just not the number that mattered.
So I got up, powered on my laptop and added wind gusts. Then, within the hour, the site had the opposite problem: it showed gusts of 44 and 45 mph for Saint Martin and Guadeloupe. That was a shocker! Those came from the same provider AccuWeather (known and awarded for its accuracy). But hey: "this is Caribbean, island wedda we talking here eh!" A provider’s gust is what a squall could do, not what one did. A few islands were gusting this morning, including Guadeloupe (32 mph at 7:30 AM) and Antigua (29 mph at 9:00 AM), and their airports had the readings to prove it. The rest were not measurements, and on a page that people on those islands read, that is not good enough!
By ~9 AM the fix was simple, and it is the rule now: gusts come only from the island’s airport weather station. Every airport in the chain publishes an official observation, the same one pilots use, and the site now reads from them all. If the airport measured a gust, you see it. If it did not, you see a dash. Nothing fills the gap. Under every wind advisory there is now a grey line saying which airport measured the reading and at what time, so you can check it against what you feel outside your door.
Those were the biggest fixes, but not the only ones. All the changes are kept in De Wedda's change log.
De Wedda: 1 year of changes, additions & improvements
The changelog is the honest record of how far this website has come. Version 1.0 had 14 islands and a few pages. Since then it has grown to 18 islands, from Anguilla to Grenada, with the French and Dutch islands and the US Virgin Islands added. Every island page got its own storm map, aimed at that island, with the Hurricane Center’s cone drawn exactly as published. Rainfall now has its own section, Saharan dust got readings in micrograms and a seven-day forecast. The map got radar, cloud cover, a graticule and the forecast cone. Wind gusts, as of this week, come from the regional airports.
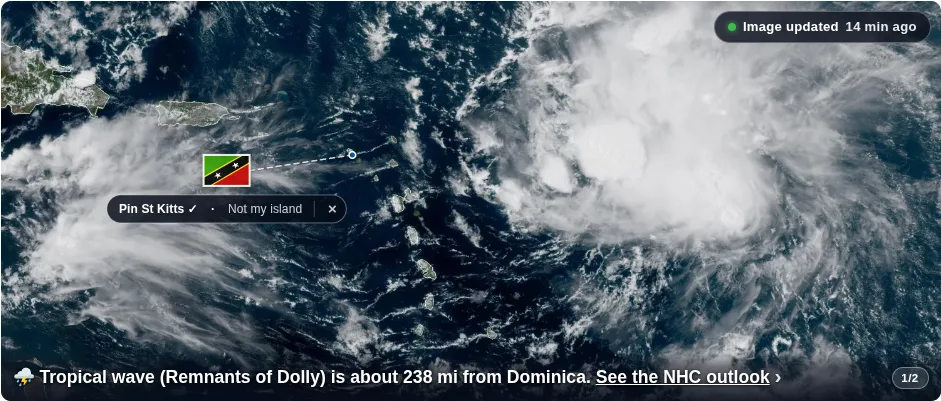
Start by pinning your island. Open the island menu at the top of the page, or the flag in the header, and choose up to three. Your islands move to the top of the list on the homepage, they are marked on the satellite image, and every time you come back the site is already about where you are. If you have family on another island, or you are traveling, pin those too.
Then open your island page. During an active system it leads with the storm overview, and the distance to the closest system, then the island’s own wind advisory if there is one, then current conditions, the hourly forecast, rainfall, dust and the history charts. On a quiet day it is the same page without the storm.
The Outlook is the regional view: the satellite image and animations, the National Hurricane Center’s discussion filtered to what concerns the Eastern Caribbean, the wind readings for every island side by side, and the forecast maps. The map is where you go to watch a system move, with radar and clouds over the islands and the forecast track and cone when there is one. And if you want an email when a storm comes within range of your island, the alert signup is on the homepage. We have sent out only 1 email alert this year, no false alarms, no hype and no fear mongering, ever!
Everything on dewedda.com comes from the National Hurricane Center, the regional meteorological offices, the islands’ airports and the other sources listed on the resources page. When there is an active storm, follow the official forecasts and your local guidance first. This site exists to help you find them faster and to answer the three questions I always have: Is there a storm that matters to us? Where is it? and, How close could it get to my island?
Looking ahead
 De Wedda
— weather watchers are following the Eastern Caribbean islands from near and far.— weather watchers.
De Wedda
— weather watchers are following the Eastern Caribbean islands from near and far.— weather watchers.
 GBUnited Kingdom
 LCSaint Lucia
 MFSaint Martin
 USUnited States and territories
 VGBritish Virgin Islands
 AGAntigua and Barbuda
 CACanada
 KNSaint Kitts and Nevis
 GDGrenada
 BBBarbados
26%United States and territories7%Antigua and Barbuda
BBBarbados
26%United States and territories7%Antigua and Barbuda 7%Dominica6%Barbados6%Grenada6%United Kingdom5%Saint Lucia4%Saint Kitts and Nevis4%Canada4%British Virgin Islands
DeWedda.com is a passion project. It satisfies my love for data analysis, presentation and trends, and it happens to be about the weather over the islands we all call home. One year in, there has been real growth, most visibly in traffic and readership. But the growth that matters most to me is the kind this week forced: better data collection, better analysis, better presentation, and above all, accuracy. That is where the next year goes.
Thank you for a year of reading. Please send any feedback and comments to [email protected].