
v2.7.0
September 1, 2026 Latest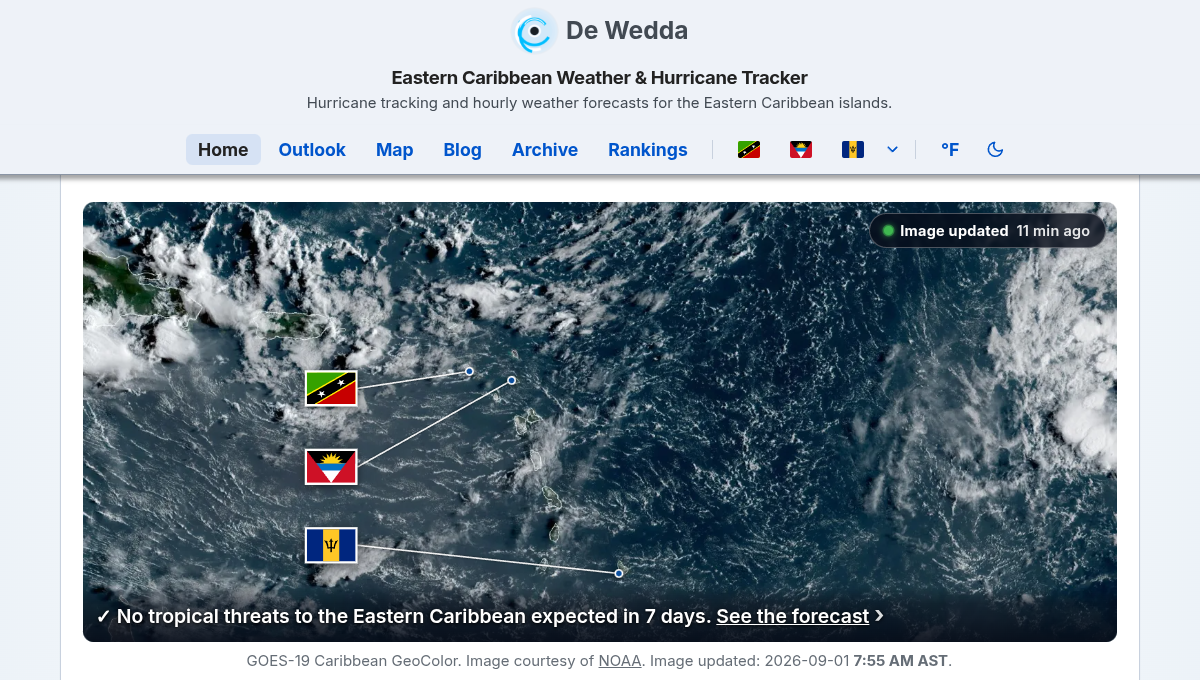
Home
- Your pinned islands are marked on the satellite image with a dot, a fine line and their flag, linking to the island page. With nothing pinned, one island is suggested with a “Pin ✓ or Pick my island” prompt; nothing is pinned until you tap
- When conditions turn severe anywhere in the region, whether wind, rain or dust, a notice now appears right under the satellite image so it is the first thing you see
- The headline over the satellite image now always fits on one line on phones
Island Pages
- Rainfall for Sint Eustatius and Saba is now measured, and rain data is now kept for the 18 Eastern Caribbean islands
- When an island has had heavy rain, a notice now appears under the storm section, and it says where the number came from
- The time shown on the storm picture now reflects how old the rain imagery really is
Outlook
- Pinned islands are marked on the satellite image here too
Rankings
- A “Last 2 days” option was added
- The accuracy notes now explain where every rainfall number comes from
Fixes
- The system near the islands was briefly labelled with the wrong name. Spotted by sharp-eyed reader Bryan Simmonds of St. Kitts. Thank you, Bryan
Resources
- Our map’s rain colour scheme is featured in the cpt-city colour archive
v2.6.2
August 30, 2026Island Pages
- Wind gusts now appear on the wind tile, and they come only from the island’s own airport weather station, so a squall shows within minutes of being measured; no gust is ever taken from a forecast estimate, and if the airport reports no gust, none is shown
- When the wind or gusts reach advisory strength, the island’s own advisory appears under the storm cards, with a second line naming the airport that measured it and the time of the report
- The wind tile names its source on hover: the airport report or AccuWeather, with the time
- Saint Martin’s readings come from Princess Juliana airport, and Saba’s from Sint Eustatius, 20 miles across the water, since Saba’s airport does not publish weather reports
Home
- The island list shows “gusts N mph” in place of the wind when the airport has measured a gust worth knowing about
- The wind advisory says where the readings were measured. With several islands named it no longer prints a single figure, which read as if all of them had reached it
Outlook
- Wind & Forecasts switches to “wind / gusts” for every island on a gusty day; a dash means the airport reported no gust above the wind. The summary reads “Squalls are gusting to 42 mph” rather than borrowing the tropical storm label, which belongs to sustained wind
Map
- Gusts on their own line in the island pop-ups, and beside the wind in the detail tile, coloured by strength
Resources
- The airport weather stations behind the wind and gust readings are listed, each linked to the airport’s own site
v2.6.1
August 29, 2026Island Pages
- The storm picture now leads the Distance section, with the system’s name and distance laid over the picture; the cards follow beneath
- The picture carries the live map’s rain radar and cloud cover, with a “Snapshot” chip giving the age of the radar frame
- The island’s flag sits on the sea side of the island, away from the system’s path, and the disturbance mark matches the live map’s
- The Antigua Met forecast time is shown as issued; it had been reading four hours early
v2.6.0
August 28, 2026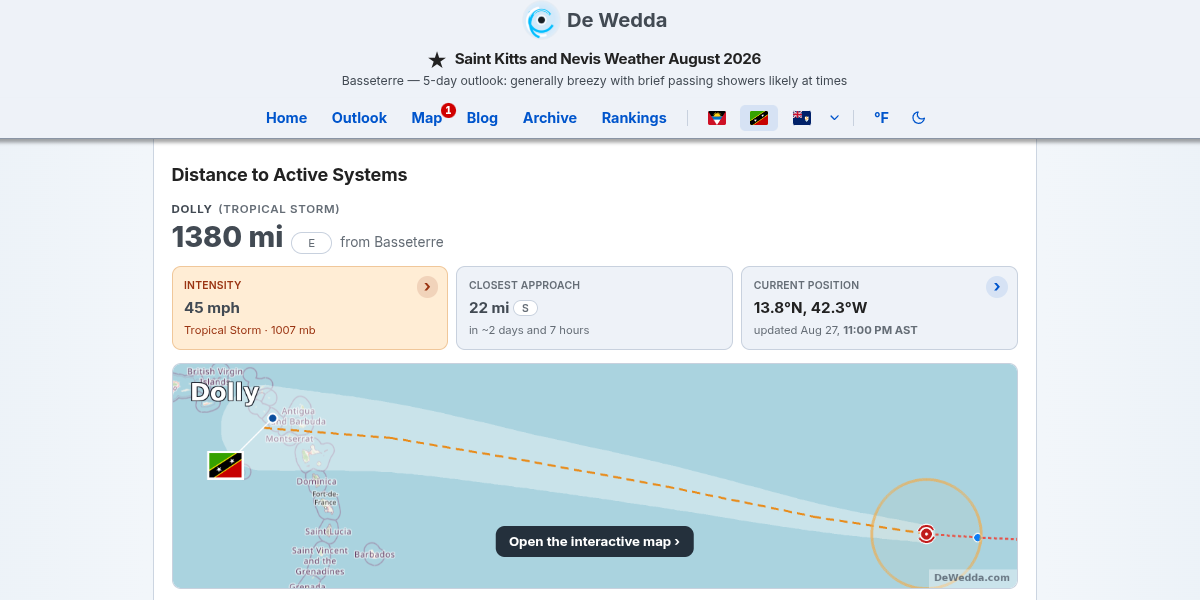
Island Pages
- Every island page now shows a storm map of its own during an active system: the forecast track aimed at that island, the National Hurricane Center’s cone of uncertainty, the wind radius, where the storm has already been, and the island marked with its own flag. Each island gets its own view, framed on itself, with a separate version drawn for phones
- The forecast track now turns grey for the part of its journey where the Hurricane Center expects the system to be a remnant low rather than a storm, so a track running towards the islands no longer implies a tropical storm the whole way
- “Open the interactive map” is now a full-width band under the picture, matching the outlook page
- The weather charts no longer animate on phones and tablets, or for anyone who has asked their device to reduce motion. A frame that stalled mid-animation was being read as broken data
Map
- The forecast cone is now drawn on the map exactly as the Hurricane Center publishes it, and named: the probable path of the storm’s centre, not the size of the storm
- The closest approach tile now carries the compass direction, so you can see which side of the island a storm passes
- Island pop-ups now include the direction and timing of the closest approach as well as the distance
- The forecast track turns grey where the Hurricane Center expects the system to weaken below storm strength, matching the island pages
- Conditions and feels-like are now one panel instead of two, with the temperature leading and the feels-like reading beside it as a small pill
Outlook
- During an active storm the page now leads with that storm, and the two tropical outlook images sit side by side instead of taking a full screen each. On phones they form a 2×2 block, and any of them can be tapped to enlarge
- The Hurricane Center’s Key Messages now appear, filtered to the ones that concern the Eastern Caribbean
- The official forecast cone and five-day wind probability graphics have been added
Home
- Storm details now come from the Hurricane Center’s written advisory whenever it is ahead of their data feed. The feed can lag by several minutes, which on a three-hourly update could leave the previous advisory showing for hours after a new one was published
Island Rankings
- A “feels like” row has been added, with the same temperature colours used elsewhere on the site applied to the values
- The community strip now sits between positions 15 and 16 as its own card, where it is far easier to notice than it was below the list
Site-wide
- The community strip – where visitors are reading from and which islands are pinned most – has moved out of the footer and into the page beside the pin controls, with the De Wedda mark and a line explaining what it is. In the footer it was decoration; people met it only after they had finished reading
- Storm alert emails: a fault that could send a second “new system” message for a system already reported has been fixed, a single reminder now goes out 24 hours after signing up if the address has not been confirmed, and confirmation links stay valid for 90 hours instead of 48
v2.5.5
August 15, 2026Home
- The satellite headline now stacks up to three lines, ranked by what matters most: the nearest system first, then island winds, rain, Saharan dust and more, instead of one line hiding everything behind the top story
- Wind headlines now use live readings, so a blustery morning shows up as it happens, instead of waiting on a daily average
Outlook
- The satellite view carries the same headlines as the homepage, and each line jumps straight to its section further down the page
- The jump buttons under the forecast (Tropical Outlook, Rainfall Tracking and so on) now only show for sections that are actually on the page, so clicking one always takes you somewhere
- The “satellite imagery” link inside the NHC discussion now works on phones and laptops, jumping to the satellite animations
Site-wide
- Every satellite view wears a new “Image updated” badge with a pulsing green dot, showing NOAA’s own publish time for the frame; it turns amber, then red, if imagery ever stops updating
- Headline lines have more breathing room on phones
v2.5.4
August 12, 2026Map
- Storm markers are far easier to tap: the clickable area used to be smaller than the mark itself
- Arriving from a storm card's Position tile now frames the system and the island chain together and opens its details straight away, instead of centring on empty ocean
- Storm details now link on to the forecast, so the map is no longer a dead end
- Fixed distances showing in kilometres for visitors set to miles, until the unit toggle was switched twice
- On phones the map can now zoom out far enough to show a distant system and the islands at the same time
Home
- A tropical wave no longer wears the hurricane symbol: the headline icon now matches what the system actually is
Outlook
- Satellite animations run about three times longer, roughly seven and a half hours of history instead of two and a half
- A new line shows how far the nearest system is and opens the live map, shading amber, orange or red as a named storm closes in
Navigation
- The Map link shows how many systems are being tracked, coloured by the highest development chance among them
v2.5.3
August 4, 2026Rainfall
- Rainfall totals now correct themselves as our sources revise recent hours, so a heavy downpour that first appears light settles to its true total within a day or two, and the full rainfall record was rebuilt against the latest source data. Thanks to Bryan Simmonds for the sharp question that led to this
- Island pages gained a "Rainfall accuracy and sources" box below the weather charts explaining how area-based rainfall measurement works and why one district can flood while the island-wide figure stays modest. The rankings page explanation was rewritten to match
Resources
- New Data Sources section listing the organizations and services behind the site's data and maps
Across the Site
- Dark mode is easier on the eyes: headings swapped bright blue for a calmer ice tone, and the page, header and side backgrounds lifted out of near-black
- Fixed the brief dark flash some visitors saw while a light-mode page loaded
v2.5.2
July 28, 2026Home
- A tropical wave crossing or approaching the islands now takes priority in the headline over Saharan dust and the day's weather standouts, so wet weather is never hidden behind a dusty day
Outlook
- Replaced the dust forecast animation with a 3-day satellite loop of the Saharan Air Layer, showing where the dust has come from over the past three days
- The Atlantic storm names list now uses the same link colours as the rest of the site, with used names struck through
Island Pages
- Current conditions no longer describe a "nice breeze" during rain or thunderstorms, using neutral wording instead
Across the Site
- The light and dark switch moved to the end of the footer navigation as a single sun or moon button
v2.5.1
July 23, 2026Island Rankings
- Added a "Data accuracy & sources" section explaining how feels-like, rainfall, air temperature, wind and humidity are measured, including a link to peer-reviewed Caribbean heat-stress research
- The live-companion link under each ranking now opens the Outlook page's satellite imagery, forecasts and rainfall tracking
Blog
- Added a "Feels like" row to the Weekly Highlights in weekly weather posts, showing which island felt hottest
- Islands that share a flag (the French and Dutch territories) now show a short code on mobile, so they're no longer ambiguous
- Cleaner category icons and several mobile layout fixes
Outlook
- The tropical-wave status line now says whether a wave is approaching, crossing or moving past the islands, based on its position
- An active storm's name now stands out on the seasonal names list in light mode
v2.5.0
July 20, 2026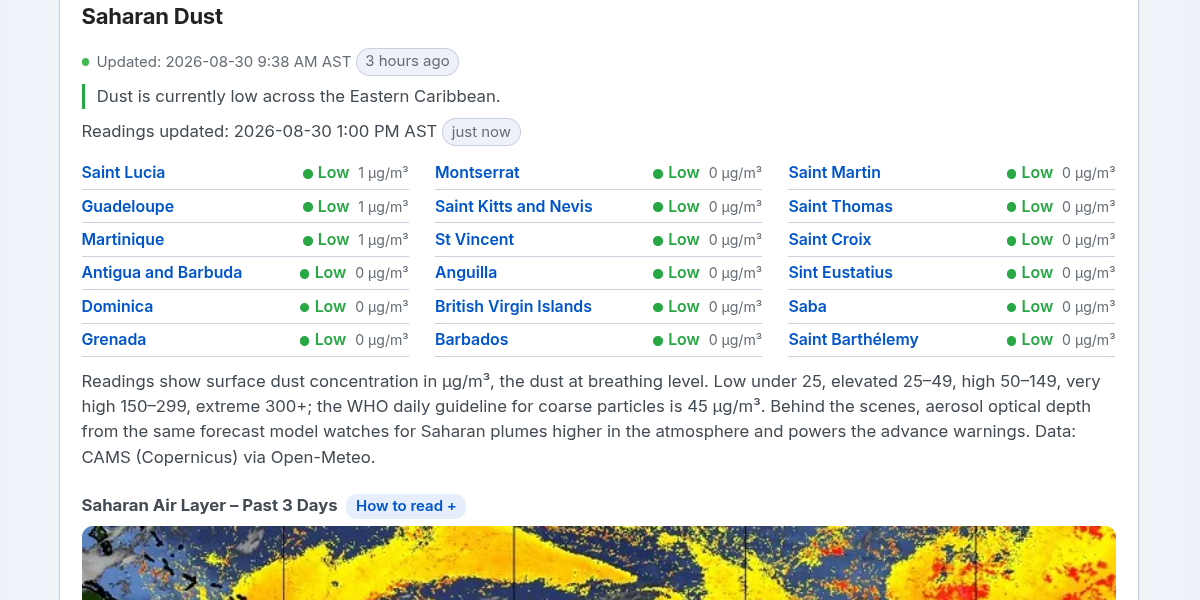
Saharan Dust
- Dust readings now show surface concentration in micrograms per cubic metre (µg/m³), the dust at breathing level, on one clear scale across the site
- Added a plain-language guide to the dust levels, anchored to the World Health Organization's daily guideline
- Island pages now show each island's dust level in µg/m³, matching the tracker
Home
- Clearer headline wording, including plain "feels like" temperatures and phrasing that reflects whether a reading is current or from earlier in the day
- Storm headlines now name the closest island and its approximate distance
- An active storm or a system developing near the islands now takes priority over dust and the day's weather standouts
- Rewrote the "About" section
Outlook
- The status line and tropical-wave alerts are now scoped strictly to the Eastern Caribbean; systems in the Gulf of Mexico or off Florida no longer appear
- A tropical wave now leaves the status line once it has genuinely moved past the islands
Island Pages
- The hourly forecast now hides hours that have already passed, so the strip always starts at the upcoming hour even if a source lags
Island Rankings
- Added a live-companion link under each ranking, pointing to the most relevant live view (wind maps, rainfall tracking, or current island conditions)
v2.4.8
July 14, 2026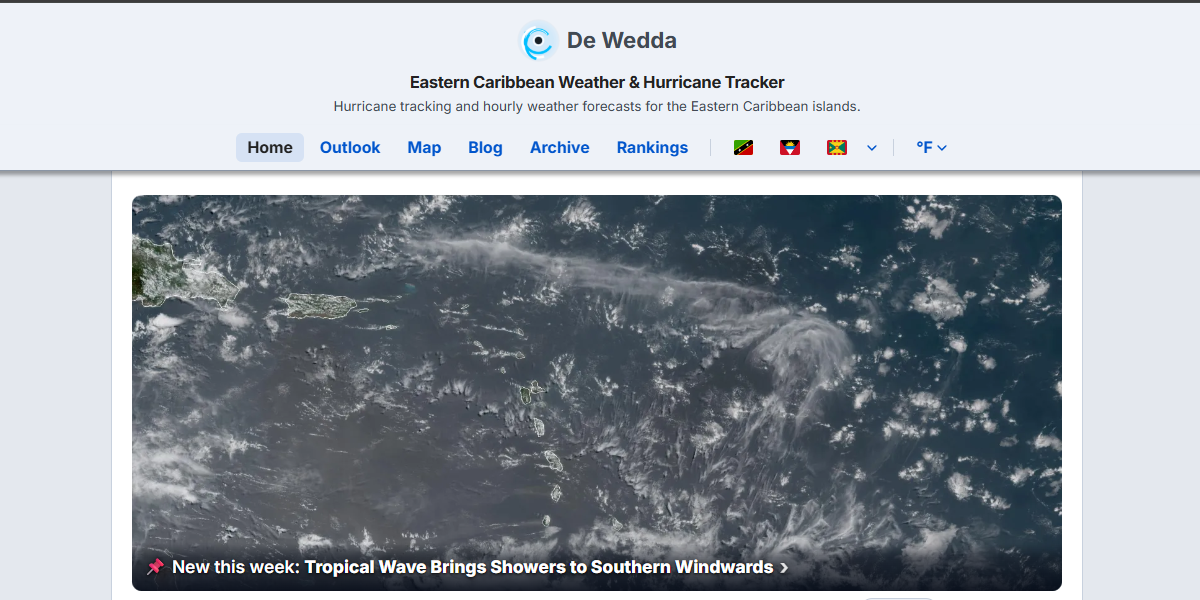
Home
- Added a live headline across the satellite image showing what matters most right now: the day's standout island (hottest, coolest, windiest or wettest), a Saharan dust alert, an active storm, or a fresh blog post, each linking straight to the detail
- The headline leads with the affected island's flag and follows your chosen °F/°C units
- The Saharan dust line now uses the same levels as the dust tracker (elevated, high, very high, extreme) and names the affected islands
Island Rankings
- Every ranking row is now fully tappable, opening that island from anywhere on the row
- Added Today and Yesterday views, measured by the local calendar day (Atlantic Standard Time)
- Tidied the intro and mobile layout; the "still filling in" note now clears itself as history builds
Outlook
- Added a status line over the satellite image: an active system, a tropical wave crossing the islands (with the area it affects), or "Atlantic quiet", each jumping to the relevant section
- Marine gales off Colombia and other far-off systems no longer appear in the Tropical Weather Outlook text, keeping it focused on the Eastern Caribbean
- A passing tropical wave now stays on the page until its showers have cleared the islands
Site-wide
- Standardised the "tap for more" chevron (›) across the site, and added an external-link arrow to outbound resource and news links on island pages
v2.4.7
July 6, 2026Rainfall Accuracy
- Rainfall for the 18 tracked islands now comes from Open-Meteo's gridded data, which closely matches official Met Service rain gauges
- We reviewed and rebuilt our historical rainfall, so past totals and charts now read accurately across the region
- With thanks to Cheryl Sandiford for flagging the rainfall discrepancy
v2.4.6
July 5, 2026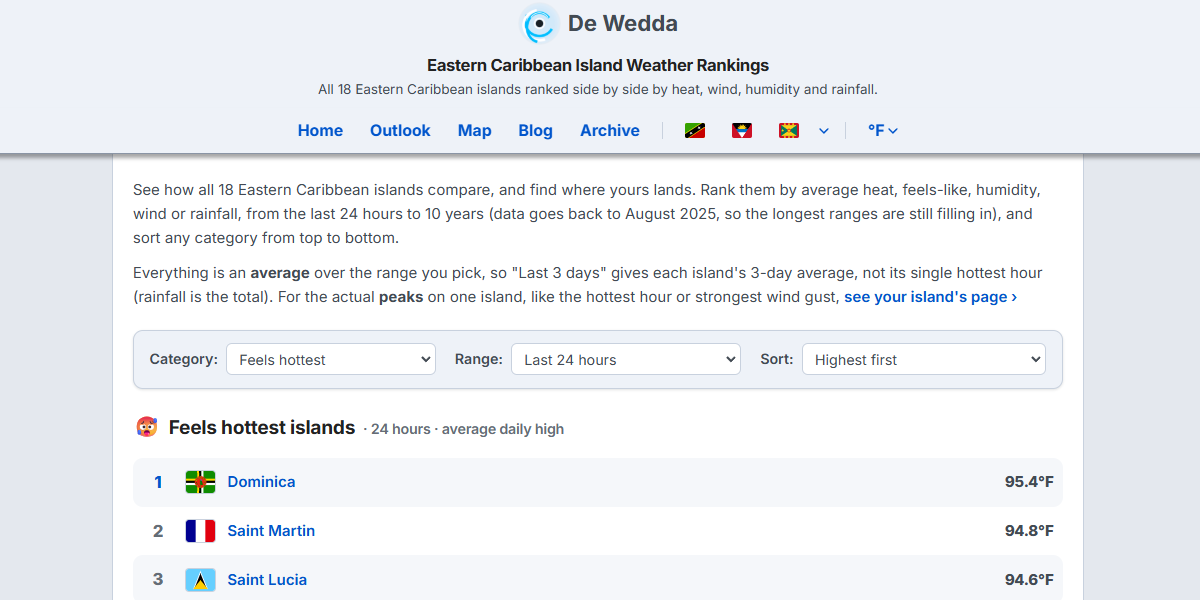
Island Rankings
- A new Rankings page puts 18 Eastern Caribbean islands side by side, ranked by heat, feels-like, humidity, wind or rainfall. Pick any range from the last 24 hours to 10 years, and sort highest or lowest
- Every island page now links through to the full rankings and shows where that island lands
- Heat rankings use each day's high (and coolest uses each day's low), so cool nights or warm afternoons do not skew the result
Weather History
- Island history charts gain longer views: 3-month, 6-month and 10-year ranges
Data Accuracy
- Sint Eustatius has no reliable local rainfall source, so its rainfall now reads "no rain data" instead of an inaccurate figure. It stays fully tracked for temperature, wind and humidity
Tropical Outlook
- The Saharan dust section now includes a 48-hour dust forecast
v2.4.5
July 1, 2026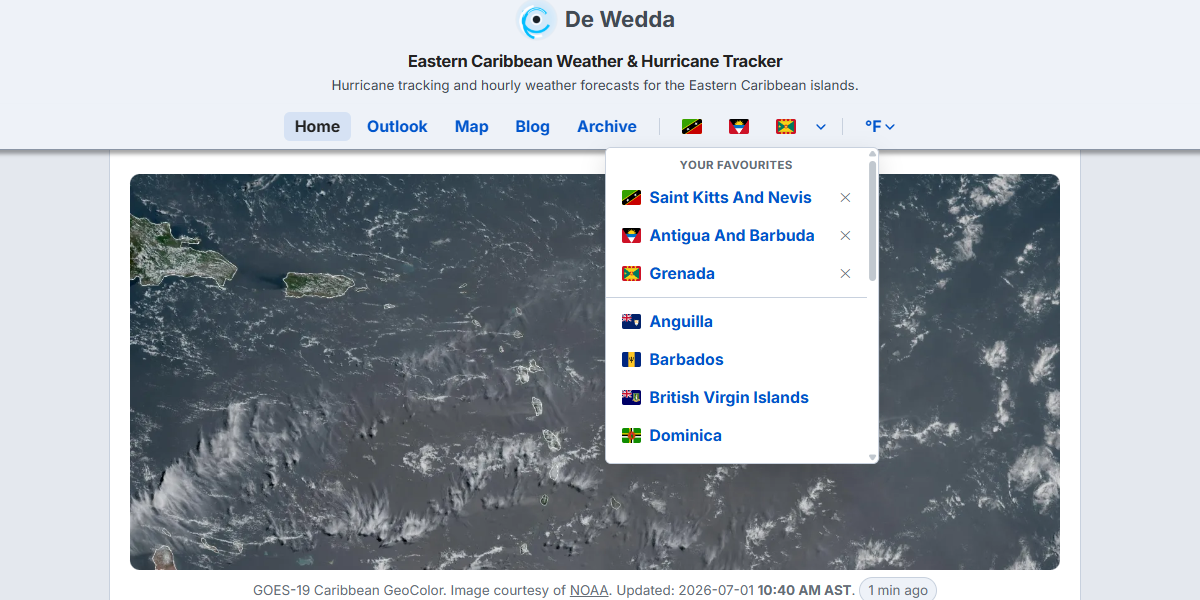
Favourite Islands
- Your pinned favourites now sit at the top of the favourites menu, each with a clear remove (✕), with the full island list below and "Clear favourites" at the end. This matches the layout on the map page
- Choosing an island from the menu now opens its weather page right away, and pins it as a favourite if you have a free slot
- Removing a favourite now asks you to confirm first, so an accidental tap on the star no longer drops an island by mistake
- Once you have three favourites, tapping a new star asks before it replaces your most recent pick, and opening an island by name simply visits its page without changing your favourites
Current Conditions
- The "feels like" temperature now has a purple "danger" level for readings of 105°F and above, sitting above red, to make genuinely dangerous heat stand out
v2.4.4
June 22, 2026Home
- Each island's current wind now changes colour as it picks up: amber when it gets very breezy (around 29 mph), then orange, red and purple for stronger winds, so you can spot at a glance
Island Pages
- The Wind tile under Current Conditions is now clickable, opening the wind forecast maps on the Outlook page
Outlook
- Wind & Forecasts: added a per-island wind list, ranked from windiest down, with a colour legend, so you can see where your island stands at a glance before reading the wind chart
- Wind & Forecasts: led the section with the 12-hour wind forecast, followed by the wave and surface forecasts
- Renamed "Caribbean Forecast Maps" to "Wind & Forecasts" and trimmed the chart labels for easier reading
- Moved Sea Temperatures to the end of the Outlook page
Rainfall Tracking
- Replaced the mixed setup with two matching NASA IMERG Early animations: a 3-hour loop covering the last 48 hours for fine band detail, and a 24-hour loop stepping through the past week one day at a time
- Each map opens on the most recent total as a still image; press play to review the history, with a clearer explanation of how it works
v2.4.3
June 21, 2026Home
- Added a 24-hour rainfall advisory: when an island has had an inch or more of rain in the last day, a colour-coded line appears below the storm status, naming the wettest islands and the rainfall level (moderate up to flood) with a short flooding-risk note. It uses the same colour scale as the Saharan dust advisory and links to the full Rainfall Tracking list
Outlook
- Out-of-region systems, such as disturbances off the US East Coast or in the Gulf, no longer appear in the Tropical Weather Outlook text, keeping it focused on the Eastern Caribbean
v2.4.2
June 19, 2026Home
- Redesigned the active-storm cards, with the system name as a bold headline and a colour-coded development-chance pill (yellow, orange, or red by likelihood)
- Replaced the full list of all islands with up to three rows: your pinned favourite islands (nearest first), or the three nearest islands if you have not pinned any, each linking straight to its weather page
- Added a "More islands" menu for the remaining islands, sorted by distance
- When several systems are active, the cards now tile side by side instead of each filling the full width
- Ordered the storm cards by how close each system is to your favourite island
Island Pages
- Redesigned "Distance to Active Systems" into modern cards matching Current Conditions, showing the system name, a colour-coded development-chance badge, the distance to your island, and tiles for the forecast closest approach and current position
- Removed the redundant reference-coordinates line, since the position is already shown
Storm Tracking & Outlook
- Systems over the Gulf of Mexico and off the US East Coast no longer appear as nearby active storms, since they sit behind the islands and never approach the Eastern Caribbean
- Made the islands in storm distance lists clickable, each linking to its weather page
v2.4.1
June 8, 2026Outlook
- Moved the surface analysis map up into the tropical weather discussion, now full-width and click-to-enlarge, and corrected its credit to the NOAA Ocean Prediction Center
- Caribbean Forecast Maps now leads with the 24-hour surface forecast
- Replaced the wave-height chart with a clearer colour significant wave height map
- Made the 12-hour wind chart click-to-enlarge
- The 7-day tropical outlook now opens a larger version when clicked
- Added a NASA 24-hour rainfall total to Rainfall Tracking
- On mobile, the Atlantic storm-names list hides pronunciations and uses two columns
- Disabled image zoom on mobile for consistency with the rest of the site
- Tidied the tropical weather summary to remove a reference to a section not shown on the page
Storm Archive
- The closest island is now colour-coded by distance, and each island links to its weather page when the approach details are expanded
- Added a proximity tag showing how close a storm came (within 100, 200, or 300 miles), in your chosen units
- Reworked the collapsed closest-approach row so it no longer wraps awkwardly on mobile
- Gave storms that came within range a thicker coloured edge for emphasis
v2.4.0
June 4, 2026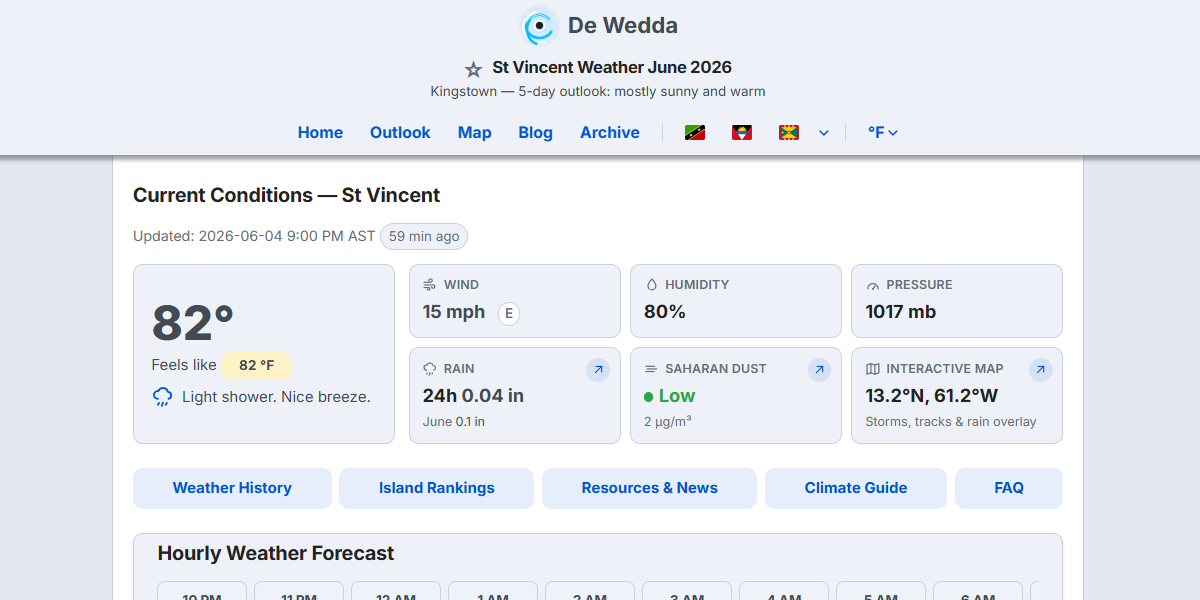
Island Pages
- Redesigned current conditions into a modern card layout, with a temperature hero and clear tiles for wind, humidity, pressure, rain, and Saharan dust that make better use of the space, especially on wider screens
- Added rainfall to current conditions, showing both the last 24 hours and the month-to-date total
- Added a live Saharan dust reading to current conditions
- Made the rain, dust, and map cards fully clickable, each opening more detail
- Added a humidity chart to the weather history, with full history back to when tracking began
- Spread the section shortcut links evenly across the full width, and moved the "updated" time up under the heading
Outlook
- Added per-island rainfall over the last 24 hours under Rainfall Tracking, with each island linking to its full weather history
- Made every island in the Saharan dust readings clickable, linking to its weather page
- Tidied the rainfall scale note so it follows the chosen units (metric or imperial)
- Spread the section shortcut links across the full width and added one above Regional Satellite Animations
v2.3.5
June 1, 2026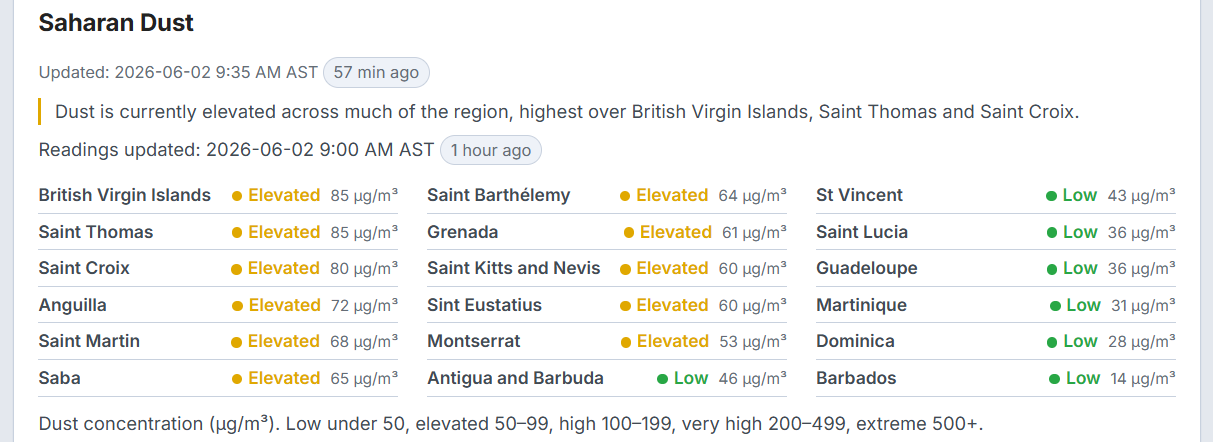
Home Page
- Added a Saharan dust advisory that appears when dust is elevated, showing its strength and the most-affected islands
Outlook
- Improved the Caribbean surface analysis map with a clearer, larger view that enlarges on click
- Further focused the tropical weather summary on the Eastern Caribbean, leaving out distant systems that don't affect the islands
- Added the season's Atlantic storm names, highlighting active and past storms with links to their history
- Added current Saharan dust levels for every island to the dust section
Island Pages
- Current conditions now show when skies are hazy from Saharan dust
v2.3.4
May 29, 2026Outlook
- Improved the tropical weather summary for the Eastern Caribbean
- Added a current regional satellite view with a lat/lon grid, opening larger on click
- Fixed wind and distance conversions to handle ranges and round to whole numbers
Island Pages
- Added context to the weather history charts explaining each time range
v2.3.3
May 5, 2026Reliability
- Fixed the Open-Meteo fallback error. It will now reliably return current conditions if the AccuWeather API fails.
v2.3.2
April 19, 2026Map
- Added cloud cover overlay (Rainbow.ai), merged into the existing Precipitation toggle
- Added Clouds legend row and refined precipitation gradient to match RainViewer tile colours
- Tuned overlay bounds to focus on the Eastern Caribbean
- Two-line legend on mobile with aligned Precipitation and Clouds bars
- Expanded help text with seasonal guidance nudging off-season visitors to Outlook
Island Pages
- Added “View island on map” link alongside Rainfall Tracker; shortened link labels
- Unified mobile spacing across the Current Conditions section
Homepage
- Added “5-day outlook:” prefix to the header forecast summary
- Island dropdown now shows capital city on desktop (Country — Capital)
Blog
- Redesigned category navigation to match the Archive pattern; mobile scrolls with fade
- Unified post header sizing, padding, and spacing with the rest of the site
Site-wide
- Standardized h2 heading size across all pages
v2.3.1
April 12, 2026Weather Data
- Switched to AccuWeather for increased accuracy, with Open-Meteo as automatic failover
- Refined rain intensity descriptions: differentiated light rain, rain, and heavy rain by precipitation amount
- Wind labels tuned for Eastern Caribbean trade wind climate (e.g., Nice breeze, Breezy, Very breezy)
Island Pages
- Two-line island cards on mobile: full island name with feels-like and wind on second line
- Full-row hover highlight on island cards (all screen sizes)
- Fixed mobile double-tap issue on island cards (hover now limited to pointer devices)
- Added island flag identifier to Current Conditions heading
Outlook
- Jump navigation added above each major section
- Replaced 1-hour rainfall composite with rain rate early product
Map
- Switched precipitation overlay to RainViewer radar for better coverage across the full Eastern Caribbean (replaced CMORPH2 and Rainbow.ai)
- Redesigned rain legend: moved below map, single-row layout on desktop, responsive labels on mobile
v2.3.0
April 9, 2026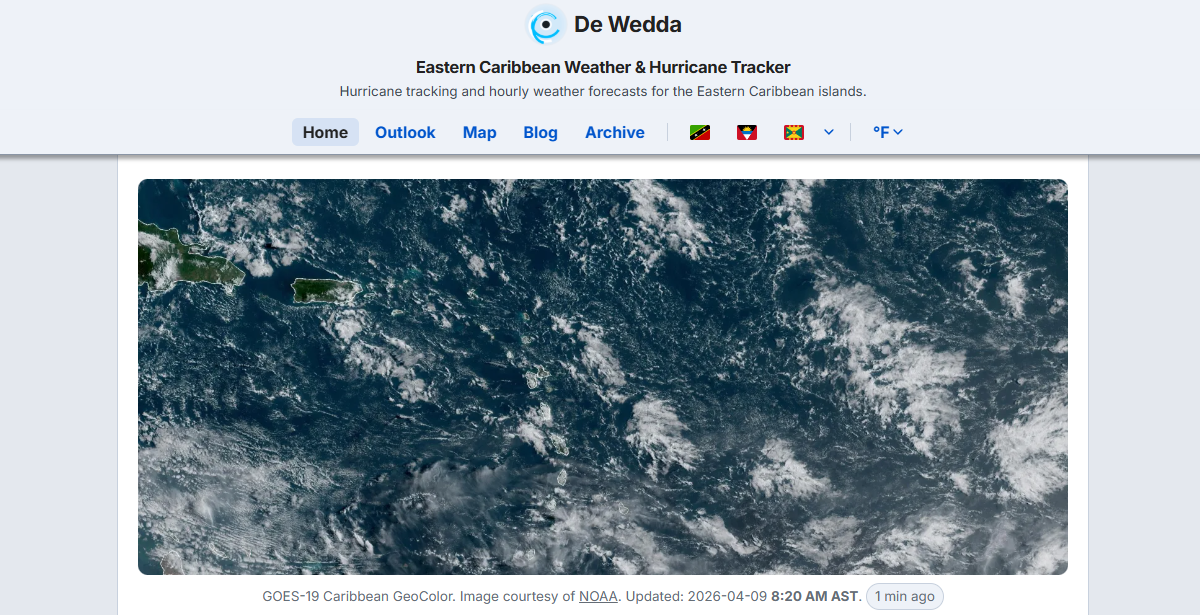
Weather Data
- Switched primary weather data source from OpenWeather to Visual Crossing (current conditions and forecasts)
- OpenWeather retained as automatic fallback if Visual Crossing is unavailable
- Cloud cover percentages used to differentiate weather descriptions (clear sky, few clouds, scattered clouds, broken clouds, overcast)
- Caribbean-friendly weather descriptions (e.g., “Passing showers” instead of “light rain”)
- Improved temperature accuracy for Dominica by switching to airport weather station coordinates
Island Pages
- Hourly and 8-day forecast data now powered by Visual Crossing
- Past hours filtered from hourly forecast display
- Forecast guidance notes added below hourly and 8-day sections
Site-wide
- Unified branded header with logo across all pages (changelog, privacy, terms, resources)
- Logo converted to WebP format (60% smaller file size)
- Updated footer credits for new data sources
- Privacy policy and terms of use reviewed and updated
v2.2.5
April 7, 2026Outlook
- New Sea Temperatures section with 7-day composite (tropical colormap) and 30-day animation
- Reordered sections: Satellite → Forecast Maps → Rainfall → Sea Temps → Saharan Dust
- Linked Early/Late rainfall labels to NASA GPM documentation
Map
- Compact map popups by merging fields
- Centered island display when “Show on Map” is clicked
- Added rain legend with ocean-blue background and opacity to match overlay
- Graticule tile gap fix applied to all browsers, lighter dark-mode grid lines
- Removed toggle panel on mobile for more map space
v2.2.4
April 2, 2026Map
- Replaced RainViewer radar overlay with satellite precipitation overlay from SSEC RealEarth
- Island weather pages now link directly to the map with rain overlay enabled and the island in view
- Progressive graticule density: grid lines adjust from 5° to 0.1° as you zoom in
- Fixed Leaflet tile gap lines between map tiles
- Fixed distance rings causing increasing lag at high zoom levels
- Fixed graticule labels not appearing at high zoom
Site-wide
- Updated data source credits (added SSEC RealEarth, OpenStreetMap)
- Switched hit counter to JS-only beacon for more accurate visitor counts (ignores bots)
v2.2.3
March 30, 2026Island Pages
- Added 48-hour hourly weather forecast section between Current Conditions and 8-Day Forecast
- Hourly cards show temperature, weather icon, wind speed & direction, and rain chance for each hour
- Added wind direction to 8-Day Forecast wind pill on desktop (e.g., "30 km/h ENE")
- Improved weather icon visibility in light mode with subtle drop-shadow on cloud icons
v2.2.2
March 27, 2026Outlook
- Improved NHC Regional Weather Summary to show only content relevant to the Eastern Caribbean
- Removed static IR satellite image from Weather Summary (same view available in Satellite Animations section below)
v2.2.1
March 22, 2026Map
- "Beyond storm tracking" section added to the map guide, highlighting useful features of the OpenStreetMap base layer for hurricane preparedness
All Pages
- Updated mobile island abbreviations: ANU→ANB, SKB→SKN, BGI→BIM, EUX→STA
v2.2.0
March 20, 2026Island List (Home & Weather Pages)
- Island cards redesigned as single-column full-width rows with country flags
- Entire island card row is now clickable (star toggle remains separate)
- Long island names abbreviated on mobile (e.g., "BVI", "St Kitts")
- Weather condition icons displayed next to temperature on each card
- Icons stored locally for faster delivery through Cloudflare
- Real Feel temperature pill shown between temperature and wind on desktop
- Real Feel uses color thresholds matching island pages (blue, orange, red, purple)
- Real Feel hidden on mobile to preserve compact layout
Island Pages
- Weekly forecast summary shown in header subtitle below page title (e.g., "Saint John's: Generally breezy with brief passing showers at times")
- Jump-to navigation added between Current Conditions and 8-Day Forecast sections
- "Resources & Local News" added to jump-to navigation pills
- Current conditions displayed in 2×2 grid on mobile with shortened labels (Temp, Wind, Press, Humid)
- Forecast day names no longer styled as blue links; dates unbolded, temperatures bolded
- FAQ section added below Climate Guide with 6 dynamically generated Q&A entries
- FAQ answers use live weather data (temperature, conditions, rain status, humidity)
- "Best time to visit" FAQ links to the corresponding blog travel guide
- FAQ jump-to pill added to section navigation
Island Rankings
- Redesigned as 4-column CSS grid layout with cross-row alignment
- Dates shown for hottest, coolest, and windiest categories
- Rain rankings now correctly exclude newer islands that don't cover the full period
- OpenWeather attribution added with link to accuracy and quality page
- Fixed tie detection comparing precise values instead of rounded display values
Blog
- Island flags shown next to island names in blog category pills
- Weather conditions pill moved inline with category pills on desktop
Map
- Map upgraded to OpenStreetMap Mapnik, a richer, more detailed base layer that includes hospitals, fire stations, shelters, helipads, bus routes, building names, and elevation contours, making the map more useful for hurricane preparedness and emergency planning
Performance & Infrastructure
- All OpenWeather icons stored locally (18 PNG files)
- Leaflet map marker icons stored locally (removed GitHub/unpkg dependency)
- Nav bar CLS prevention: dynamic min-width based on favourite count
- Consolidated footer counter queries (3 fewer DB round-trips per page)
All Pages
- Floating back-to-top button appears after scrolling past 30% of page height
- Smooth scroll to top with fade-in animation
- Themed for both light and dark mode
Navigation
- Blog link moved after Map in header and footer navigation
Footer
- StackLinux hosted-by logo added with automatic light/dark mode support
Bug Fixes
- Fixed rain rankings excluding all islands from 1-year and 3-year views
- Fixed rankings refresh causing page to scroll to charts section
- Fixed mobile nav dropdown pill shifting between pages
v2.1.0
March 12, 2026Navigation
- Sticky navigation bar stays pinned to the top when scrolling on all pages
- Only one nav dropdown can be open at a time; opening one closes the others
- Nav hover pill sizes unified across all interactive elements
- Mobile dropdown button always shows active background for better visibility
- Mobile unit toggle text de-emphasised to distinguish from page navigation links
Charts
- Chart colours update dynamically when switching between light and dark mode
- Chart watermark repositioned to bottom-centre
- Chart watermark opacity tuned for better visibility in both themes
Bug Fixes
- Fixed island rankings "tied with" showing the same island as both winner and tie partner
- Fixed gold warning text failing WCAG contrast check in light mode on outlook page
- Fixed nav dropdowns hidden behind Leaflet map on the map page
- Fixed 500 error on island pages caused by query parameter mismatch
- Fixed island switcher not initialising correctly on page load
- Fixed canonical URLs using query strings instead of friendly paths
- Fixed blog category pill colours being overridden by visited link styles
- Fixed blog post heading hierarchy (post title as H1)
- Fixed rainfall tracking not capturing all 30-minute intervals
- Fixed stale satellite animation frames due to caching issue
- Fixed NHC weather summary schedule text varying by season
- Fixed JavaScript scope collision on island pages
v2.0.0
March 11, 2026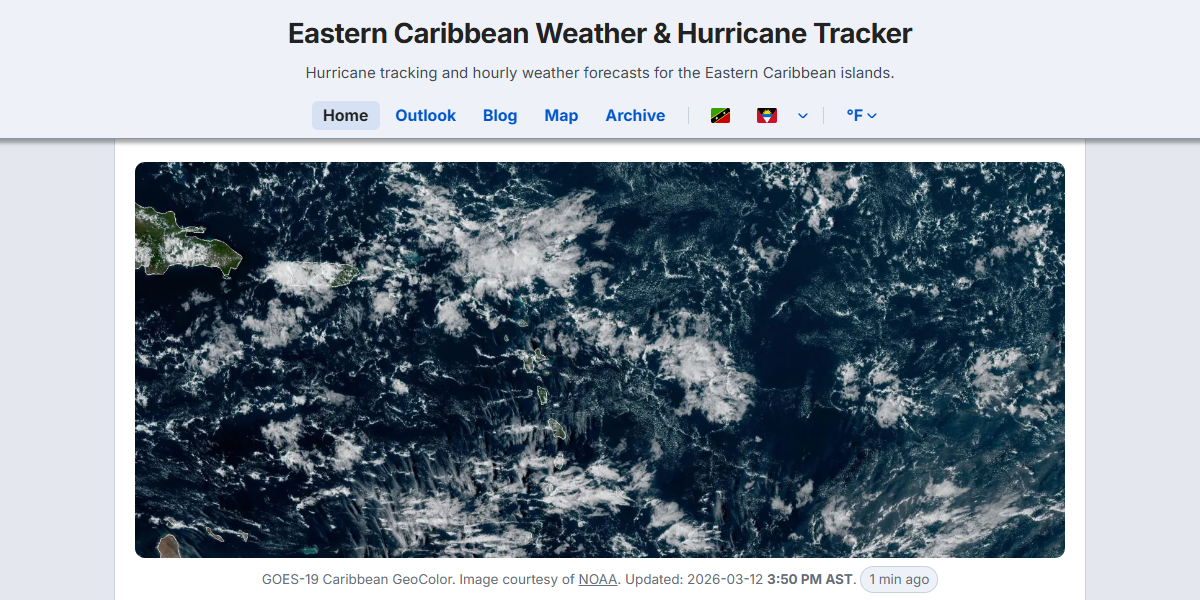
Navigation
- New desktop navigation bar with page links and favourite island flags
- Pin up to 3 favourite islands from a dropdown picker in the nav bar
- Mobile navigation consolidated into a single dropdown menu
- Unit toggle (°F/°C) moved into navigation bar, defaulting to Imperial
Light Mode
- Light mode with system preference detection and manual theme toggle
- CSS variable system replacing hardcoded colours site-wide for consistent theming
- Light map tiles when in light mode
- Theme-aware chart colours that adapt to light and dark mode
- WCAG AA contrast fixes across all pages for both themes
Island Pages
- New Island Rankings section comparing the 18 tracked islands across 5 weather categories (hottest, coolest, windiest, wettest, driest)
- Island switcher now updates charts inline without a full page reload
- Charts load only the default 7-day range on page load; other ranges fetched on demand
- Range selector synced between rankings and charts
- Island flags shown in header, rankings, and nearby islands sections
- Related blog posts section added above Nearby Islands
- "More Weather Updates" section linking to weekly weather and hurricane season blog posts
- Chart watermark added (dewedda.com)
- Taller chart aspect ratio on mobile for better readability
Blog
- Blog post navigation restructured with breadcrumb-style pills
- Island name shown as a pill on blog index cards
- Categories renamed: "Travel Guide" to "Travel Weather", "Weekly Update" to "Weekly Weather"
- Hurricane categories grouped together in the filter bar
- Current weather conditions shown inline on travel blog posts
- Cross-links and related content sections added to blog posts
- Previous/next navigation sorted alphabetically for travel and history posts
- Featured images added to blog listings
Storm Archive
- Year navigation moved from header into the content area below the nav bar
- Improved contrast on archive page badges and distance colours
Performance
- Pages load faster: rankings are prepared ahead of time instead of on every visit
Site-wide
- Improved readability with higher contrast text and 0.85rem minimum font size
- Weather descriptions unified across the map page
v1.3.2
March 5, 2026Outlook Page
- Rainfall Tracking now plays a 12-frame animation of rain movement over the past 6 hours, with AST timestamps
- Added 3-hour rainfall composite animation for tracking rain bands and heavy rainfall events
- New "Dust Tracking" section with Saharan Air Layer and GOES Dust RGB imagery, moved to its own dedicated area
- GOES Dust RGB now listed first in Dust Tracking since it works around the clock
- "How to read" labels added to all expandable image descriptions for better discoverability
- Saharan Air Layer Natural Color image now holds the last daytime capture overnight instead of going dark
- Enhanced NHC infrared summary image with zoomable view and freshness timestamp
- Satellite animations now pause for 2 seconds on the last frame before looping
Map
- Added printable Eastern Caribbean hurricane tracking chart with PDF download
Performance
- Satellite animations are faster to load.
v1.3.1
March 2, 2026Island Pages
- Color-coded heat map on the monthly weather table for temperature, rainfall, and rainy days
- Monthly weather data toggles between metric and imperial units
- Rainfall values now display with correct decimal precision
- 8-day weather forecast with weekly outlook summary based on wind, rain probability, and temperature patterns
- Forecast wind speed and precipitation percentage shown on each forecast day
- Forecast icons brightened for better visibility on dark backgrounds
- Forecast high and low temperatures rounded to show the full daily range
- Weekly outlook only names a specific day when conditions genuinely spike above the rest of the week
- Monthly Weather table renamed to Monthly Climate Averages with descriptive subtitle
- Official Resources and Local News sections now link to the full Resources page
Blog
- Info note at the end of each blog post explaining the weekly publishing schedule and storm coverage
- Inline email subscribe form for storm alerts within the blog info note
- Dismissible subscribe section that remembers preference across visits
- Blog listing page now links to Archive instead of itself in the navigation
Map
- Map background switched to dark mode to better match the site's dark theme
Accessibility
- Improved link visibility on smaller text elements (captions, credits, attributions) by styling links in a matching gray with underlines, making them easier to identify for all readers including those with low vision
Bug Fixes
- Fixed subscribe form CSRF validation failing on blog post pages due to session timing
- Fixed freshness badge colors appearing too bright on stale and critical states on blog pages
- Fixed sitemap generating invalid XML output
Outlook Page
- New "Rainfall Tracking" section with satellite-derived rainfall imagery from NASA IMERG
- Visible satellite close-ups (Leeward & Windward Islands) moved to the Regional Satellite Animations section
- Satellite animations can now be stopped by clicking again
- Sea Surface Temperature 7-day image grouped with the 30-day SST under Caribbean Forecast Maps
Performance
- Optimized js, css, images and html code for even faster page loads
Site-wide
- Weather descriptions adjusted for time of day and cloud coverage accuracy
- Wind speed labels recalibrated for Caribbean trade wind conditions
- Added upward arrow indicator to the "Back to Top" link in the footer
- Removed share boxes from all pages
- Increased minimum font sizes on smaller text elements for better readability
- Brightened muted text across the outlook and blog pages for improved contrast
v1.3.0
February 26, 2026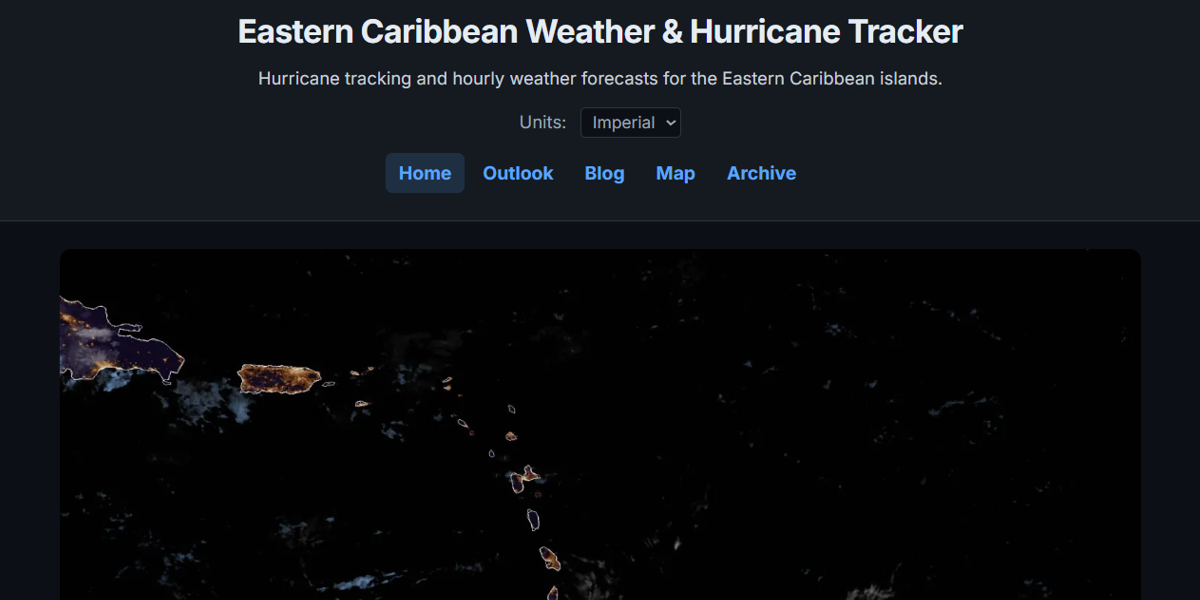
Blog
- New weekly weather blog featuring data from the most recent NHC forecast discussions and regional observations
- Blog listing page with paginated posts, excerpts, and freshness badges
- Individual blog post pages with previous/next navigation
- RSS feed available at /feed for blog subscribers
- Weekly Highlights section showing hottest, coolest, windiest, wettest, and driest islands with peak dates
- Storm Tracker section that appears when a tropical system is detected near the region during hurricane season
- Satellite imagery included in each post with NASA/MSFC attribution
- The weekly weather post now publishes automatically every Monday morning
New Pages
- New Resources page with curated weather, hurricane tracking, and disaster preparedness links for the region
- New Privacy Policy page
- New Terms of Use page
Storm Archive
- Renamed "Storm History" to "Storm Archive" with updated URL (301 redirects from old URLs)
Navigation
- Added "Blog" link to the header navigation across all pages
- Renamed "Interactive Map" to "Map" in header and footer navigation
- Consistent 4-link navigation on every page (each page excludes its own link)
- Footer links updated with Resources, Privacy Policy, and Terms of Use
Island Pages
- New Climate Guide section on all 18 island pages with Climate Overview, Hurricane History, Monthly Weather, and Geography & Terrain
- Added "Last 7 days" chart range with 3-hour averaged readings, set as the new default view
- "Last 3 days" chart now shows hourly readings instead of 3-hour averages for finer detail
- "Last 30 days" chart now shows daily averages instead of twice-daily for cleaner trend lines
- Updated chart description text to explain all five range options
- Weather descriptions replaced with Caribbean-appropriate labels
- Forecast descriptions vary based on precipitation probability for more natural day-to-day variation
- Wind speed labels updated with Caribbean-natural wording
Outlook Page
- New "Rainfall & Visible Close-Ups" section with 3-hour rainfall accumulation and visible satellite close-ups of the Leeward and Windward Islands
- Jump-to navigation bar for quick access to imagery sections
- All imagery sections now visible by default instead of hidden behind expand/collapse bars
- URLs in the weather summary now display as shortened domain names instead of full URLs
- Image width and height attributes added dynamically across all outlook images to prevent layout shift
- Removed share box (WhatsApp and email share buttons)
- NASA IMERG precipitation resources added to the Resources page
Bug Fixes
- Fixed a fault that could leave current conditions stale after an image update
SEO
- Structured data (JSON-LD) for BlogPosting and Blog schema
- XML sitemap updated to include blog posts
v1.2.4
February 24, 2026New Islands
- Added 4 new islands: Saint Croix (USVI), Sint Eustatius, Saba, and Saint Barthélemy, bringing the total to 18 Eastern Caribbean islands
- Renamed "St Vincent & Grenad." to "St Vincent" for clarity
Island Pages
- New "Official Resources" section on each island page with links to local weather and disaster preparedness agencies
- New "Local News" section on each island page with links to local newspapers and news outlets
- Official Resources and Local News sections displayed side-by-side on desktop
Bug Fixes
- Fixed chart comparison alignment for newly added islands with partial data
Outlook Page
- Fixed Caribbean Sea Surface Temperature animation play button not working
- Tropical Weather Outlook season window updated to match NHC schedule (May 15 – November 30)
- Tropical Weather Outlook now visible off-season when the NHC issues a special outlook
- Switched weather summary source to the Eastern Caribbean Forecast for broader regional coverage
- Improved off-season Tropical Weather Outlook detection using issuance timestamp instead of file age
- Added freshness indicators to satellite animations, satellite images, and forecast map sections
- Added freshness indicator to the NHC Regional Weather Summary showing time validity
- Added description notes below the NHC Regional Weather Summary and Caribbean Forecast Maps headings
Home Page
- Forecast section now shows a condensed preview with a link to the full forecast on the Outlook page
Site-wide
- Added a visitor counter to the footer of the website
- Improved visitor counter accuracy with expanded bot detection
- Code cleanup and reduced page weight
- Moved page-specific CSS from global stylesheet to inline blocks for reduced page weight
v1.2.3
February 20, 2026Map
- Island list redesigned from a two-column grid to a single dropdown selector with a detail panel
- Detail panel shows coordinates, copy button, Show on Map, View weather page, and current weather conditions
- Favourite islands appear at the top of the dropdown in a separate group
- Selecting an island in the dropdown centres the map on that island and shows distance rings
- Clicking a map marker updates the dropdown selection and detail panel
- Previous non-favourite markers are automatically removed when selecting a new island
- Inline weather data row showing temperature, conditions, wind, pressure (desktop), and humidity (desktop)
- Updated timestamp with freshness pill showing how recently weather data was refreshed
- "How to Use This Interactive Map" section now always visible instead of collapsed
- Coordinates line centred on mobile for better alignment
Storm Archive
- CPA summary row toggles between "CPA" (collapsed) and "Closest Point of Approach" (expanded)
- Distance colour coding (red, orange, yellow) now applies only to distance values, not island names
- Hover highlight on CPA summary rows
- All dates now show full day of week and month name on desktop (e.g., "Tuesday, October 21, 2025")
- Shorter abbreviated dates on mobile to reduce wrapping (e.g., "Oct 21, 2025")
- Maximum intensity and CPA dates right-aligned with a faint dashed leader line on desktop
- Dates drop to their own line on mobile for cleaner readability
Site-wide
- Removed underlines from pill-styled links on hover across all pages
- Replaced Font Awesome clipboard icon with inline SVG for reliable rendering
v1.2.2
February 19, 2026Map
- Island weather pages now link directly to the interactive map, zoomed in on that island
- "Show on Map" links now position the island marker lower on the map for better visibility
- Island markers remain visible when navigating from other pages
- Reset map now clears any island-specific view and returns to the full overview
Island Pages
- Color-coded "feels like" temperature pill (blue, orange, red, or purple based on intensity)
- Current conditions metrics reordered: Temperature, Wind, Pressure, Humidity
- All weather values displayed in bold for easier scanning
- Metric labels given a muted colour to better distinguish values from labels
- Temperatures rounded to whole numbers for consistency with forecasts
- Map link styled as a bold pill for better visibility
Outlook Page
- New GOES East Infrared animations for the Caribbean and Atlantic added to the satellite animations section
- New Additional Satellite Images section with SAL Natural Color, SAL Dust Tracker, and GOES RGB Dust imagery
- Color-coded legend below the GOES Dust RGB image explaining what each colour represents
- Image and animation descriptions moved above each chart as collapsible headings
- Expandable explanations added for all forecast charts, satellite animations, SST, and dust imagery
- Only one description can be expanded at a time to keep the page compact
- Uniform heading names for NHC charts: Caribbean 12-hr wind, surface analysis, and wave height
- Satellite animation play button moved to bottom-right with "PLAY" label
- Animation overlay now transparent by default, darkens on hover
- Rewritten satellite animations introduction for clarity
- Source-specific attribution below each animation (NASA/MSFC or NOAA)
- Key links styled as pills for consistency across the site
- "Additional Satellite Images" renamed to "Regional Satellite Images"
- Dust colour legend moved inside the collapsible GOES RGB Dust description
- Satellite image lightbox disabled on mobile where full-size viewing offers no benefit
- New NHC Caribbean Forecast Charts section with wind, surface analysis, and wave height charts moved from the weather summary
- GOES East Infrared satellite image inserted inline within the weather summary text
Performance
- Animation placeholder images and static satellite imagery now served locally instead of from external CDNs
- Images are smaller and faster to load
Site-wide
- New footer navigation with links to Home, Weather Locations, Outlook, Interactive Map, Storm Archive, and Back to Top
- Current page highlighted in the footer navigation
Weather Page
- Inline links to Outlook and Interactive Map styled as pills for consistency
Home Page
- Added note directing visitors to the Weather Locations page for a weather-only view
Accessibility
- Descriptive alt text and title tooltips added to all images and animations on the outlook page
- Navigation links bolded site-wide for better readability
Bug Fixes
v1.2.1
February 15, 2026Performance
- Satellite images now served in WebP format with JPEG fallback.
- Prioritised loading of above-the-fold satellite images for faster page rendering
- Cross-page image prefetching between home and outlook pages for faster navigation
- Fancybox CSS loaded asynchronously to eliminate render-blocking
- Google Fonts now served from Cloudflare edge, reducing external requests and latency
Map
- Replaced weather overlay with higher-quality radar data from RainViewer
- Full screen toggle now hidden on devices that do not support the Fullscreen API
- NHC tracking chart download link moved inside the collapsible "How to use" section
- Removed "Map Companion" heading for a cleaner layout
- Island list now always displays all 14 islands regardless of favorites filter
- Toggling a favorite star now immediately updates marker visibility on the map
- Removed underline decoration on zoom controls
- Tighter padding on map info panel
Storm Archive
- Added visual legend with side-by-side storm classification and CPA charts
- Legend moved from the top to the bottom of the storm list
Features
- Shareable weather chart links on island pages via URL hash parameters
- Temperature comparison line colour changed to lighter blue for better contrast
Improvements
- Updated home page intro text, storm greeting messages and About section wording
- Consistent border-radius across all images and containers on the outlook page
- Updated footer disclaimer wording
- Simplified satellite image markup on the outlook page, removing redundant DOM elements
- Consistent mobile and desktop behaviour for satellite image lightbox across all pages
Accessibility
- Improved footer text contrast for better readability
- Version link in footer restyled for consistency with surrounding text
Bug Fixes
- Fixed subscribe form CSRF token failing due to premature session output
- Fixed radar overlay not loading when the toggle was already checked on page load
v1.2.0
February 8, 2026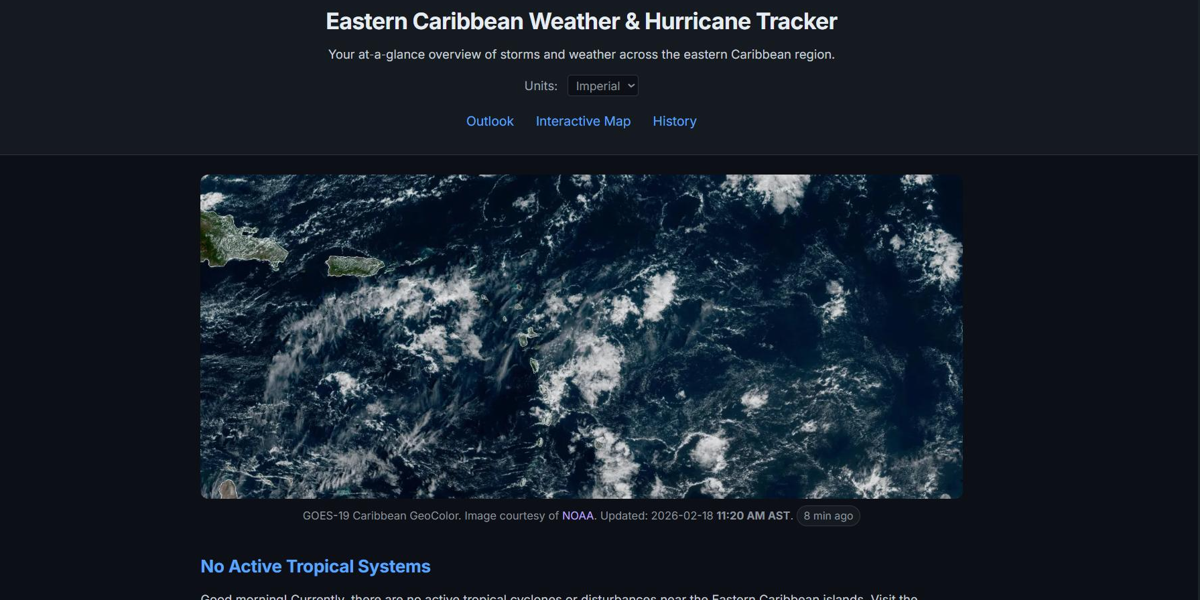
Performance
- The home and weather pages load faster
- External scripts now load asynchronously where possible to reduce render-blocking
- Below-fold images use lazy loading
- Added DNS prefetch hints for CDN resources
Interactive Map
- Map now fills 60% of viewport height (responsive) instead of a fixed 400px
- Map controls restyled with custom toggle switches replacing plain checkboxes
- Island list redesigned as mini-cards with hover effects, gold left-border accent for favorite islands
- "Using this map" section converted to a collapsible accordion, collapsed by default to reduce page length
- Island list now displays all islands in a two-column grid (single column on mobile)
- Island weather page links now use friendly URLs and open in the same window
- Removed duplicate inline CSS already covered by the shared stylesheet
Storm Archive
- Storm cards now display color-coded classification badges
- Left-side color bar on storm cards reflects CPA proximity rather than storm intensity
- Distance color coding consistent everywhere: CPA island list uses the same yellow/orange/red thresholds
- CPA island list changed to single-column layout for improved readability
- Improved CPA accordion with custom expand/collapse indicator and top border separator
- Year navigation updated from pipe-separated links to pill-style buttons
- Storm cards have hover effects and consistent styling with the rest of the site
Security
- Added form protection across all subscription forms
- Security headers (content type sniffing protection, frame options, referrer policy) added site-wide
- Sensitive configuration values moved to environment variables
Code Quality
- Removed 30+ legacy backup files from the repository
- Consolidated duplicate helper functions into a single shared module
- Extracted shared CSS from inline styles into the main stylesheet
- Extracted shared JavaScript into an external file
New Features
- Data freshness indicators now shows "Updated X minutes ago" with color-coded staleness warnings
- Skip-to-content links and ARIA landmarks added for improved accessibility on all pages
v1.1.0
December 23, 2025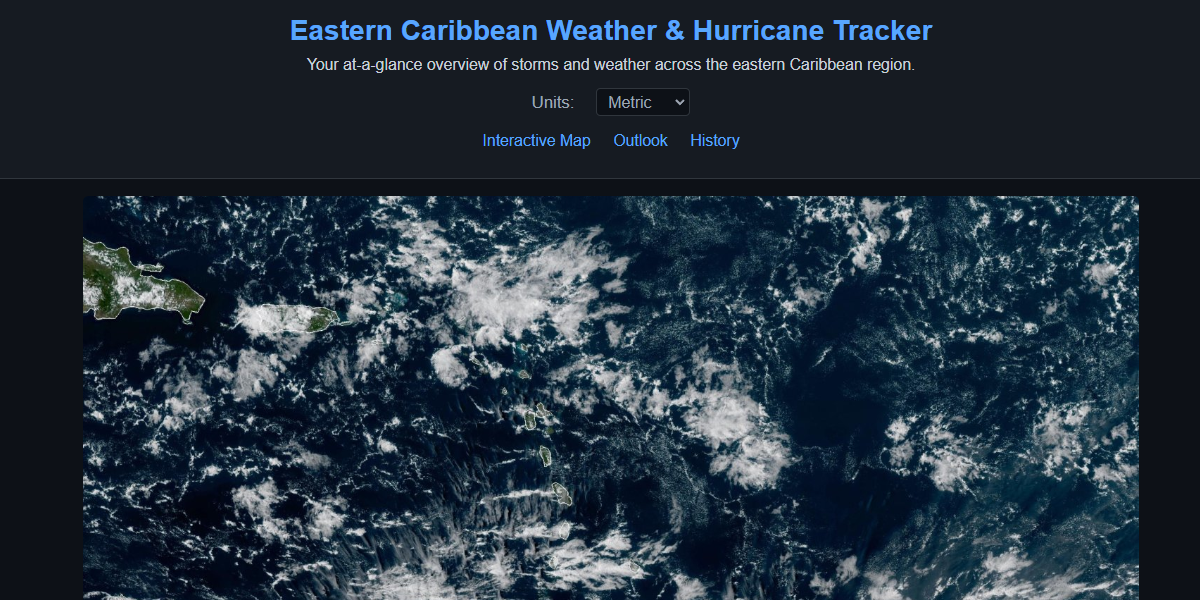
Design Refresh
- New typography: switched to Inter for a sharper, more professional feel across all pages
- Full CSS modernisation for consistent colours, spacing, and typography site-wide
- Improved island cards: updated spacing, hover effects with animation, and smooth transitions
- Responsive island grid: 3 columns on desktop, 2 on tablet, 1 on mobile
- Added focus states and accessibility improvements on form inputs and dropdowns
- Navigation links updated with pill-shaped hover backgrounds
- Storm cards refreshed with larger border-radius, box shadows, and hover glow
New Features
- Island switcher dropdown on island pages – jump between islands
- Island comparison feature on island pages – for side-by-side analysis
- Weather history charts
- Regional Weather Outlook call-to-action added on the home page
- Weather page now includes a link back to the full site
- Weather descriptions cleaned up (e.g. "light intensity shower rain" = "light rain")
SEO & Meta Tags
- Dynamic month/year added to page titles and structured data across all pages
- Page-specific tags on every page (previously all pointed to the home page)
- Canonical tags added to all pages
- JSON-LD structured data (WebSite, WebPage, Place) added to every page
- Sitemap for search engines
- Interactive Map page: full social sharing tags added (previously missing)
Code Quality
- Consolidated compass bearings, distance calculations, URL slugs, timezone conversion
- Consolidated favicon and app icon markup into a single shared include used by all pages
- Significant reduction in code duplication across the site
Improvements
- Inline styles across all pages updated to use design tokens instead of hardcoded
- Weather page fully synced with home page layout, spacing, and styling
- Mobile alignment fix for chart control dropdowns on island detail pages
- Removed inline style overrides from header links for cleaner markup
v1.0.0
August 6, 2025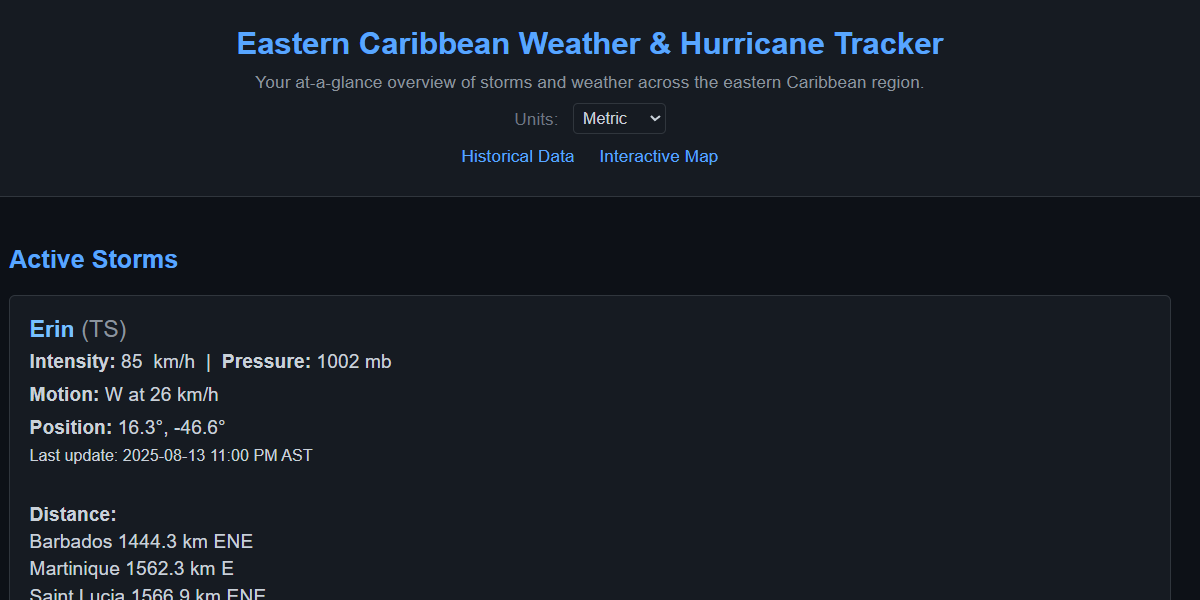
Initial Release
- Live weather conditions for 14 Eastern Caribbean islands updated hourly
- Active storm tracking with NHC forecast data, wind radii, and CPA per island
- Interactive hurricane map with forecast tracks and wind radius visualisation
- Weather history charts (wind, pressure, temp, rainfall) with multiple time ranges
- Eastern Caribbean weather outlook with GOES-19 satellite imagery
- NHC tropical weather discussion, and offshore forecasts
- Historical storm archive browsable by year
- Email alert subscriptions for storm proximity warnings
- Imperial/metric unit toggle persisted across visits
- Favourite islands feature (pin up to 3 islands to the top)
- Mobile-responsive dark theme design