PrecipitationPrecip and cloud overlays update every ~10–30 mins.
Select an island to view its details. Click the star to add it to your favorites (up to 3).
 De Wedda
— weather watchers are following the Eastern Caribbean islands from near and far.— weather watchers.
De Wedda
— weather watchers are following the Eastern Caribbean islands from near and far.— weather watchers.
 VCSaint Vincent and the Grenadines
 USUnited States
 NLNetherlands
 CACanada
 VIU.S. Virgin Islands
 LCSaint Lucia
 SXSint Maarten
 AGAntigua and Barbuda
 JMJamaica
 DMDominica
41%United States
DMDominica
41%United States 6%United Kingdom
 6%Barbados
 5%Grenada5%Saint Lucia5%Dominica5%Canada4%Antigua and Barbuda
 3%Saint Kitts and Nevis3%Saint Vincent and the Grenadines

How to Use This Interactive Map
This map is designed primarily for hurricane season (June 1 – November 30). When tropical systems are active, storm positions, forecast tracks, past tracks, wind radii and closest‑approach distances are automatically plotted using the latest National Hurricane Center advisories. Outside of hurricane season and when no storms are active, the Outlook page is the best place for day‑to‑day weather monitoring.
Favorites only
Click the star next to any island to mark it as a favourite (up to 3). Your favourites are saved in your browser, so the next time you visit the map it automatically zooms to your favourite island. From the island detail panel you can copy its coordinates, jump to it on the map, or go straight to its full weather page.
Island icons
Toggle island markers on or off. Click any island marker to see its latest weather — feels-like and actual temperatures, current conditions, wind speed with Beaufort descriptor, pressure, humidity and last update time. Three concentric distance rings appear around the selected island showing approximate distances of 100, 200 and 300 miles100, 200 and 300 km, useful for gauging storm proximity along the forecast track.
Forecast cone
The shaded area around the forecast line is the cone of uncertainty: the probable path of the centre of the storm, drawn by the National Hurricane Center and shown here exactly as they publish it. It is formed by sweeping a circle of the average recent forecast error along the track, which is why it widens further into the future.
Two things it does not mean. It is not a map of where the storm's effects reach — damaging wind, rain and surge regularly occur well outside it, and a large storm can affect your island while its centre passes far away. And the centre itself stays inside the cone only about two times in three, so a track that looks like a near miss today can still become a direct one. Always follow your national meteorological service for warnings.
Closest approach (CPA)
Island pop-ups include a Closest approach line showing the minimum distance between the island and the storm's forecast track, with an approximate time. It does not imply landfall — values may change as the NHC updates its forecasts.
Past track
When an active storm is being tracked, this toggle shows or hides its historical positions — small markers indicating where the storm has already been. Use the past track alongside the dashed forecast line to see the storm's full trajectory.
Past positions carry the storm's strength at that moment:
- Tropical depression (under 39 mph)(under 63 km/h)
- Tropical storm (39–73 mph)(63–118 km/h)
- Category 1 (74–95 mph)(119–153 km/h)
- Category 2 (96–110 mph)(154–177 km/h)
- Category 3 (111–129 mph)(178–208 km/h)
- Category 4 (130–156 mph)(209–251 km/h)
- Category 5 (157 mph and above)(252 km/h and above)
The dashed line ahead of the storm is its forecast track:
- Still a tropical cyclone
- Expected to be post-tropical or a remnant low
A track that turns grey before it reaches the islands is one the National Hurricane Center forecasts to weaken on the way.
Precipitation overlay
This overlay shows two layers updated every 10 minutes: cloud cover and precipitation radar. White and grey shading represents moisture and cloud density — the more intense the white, the thicker the cloud cover. Precipitation shows up as colour in the legend range from light (blue/green) to heavy (yellow/red).
Keep in mind that brief passing showers, common across the Caribbean, may not always appear on the radar overlay due to limited ground-based radar coverage across the region. However, during tropical waves, tropical depressions and organised storm systems the overlay is much more reliable, as the moisture is widespread and sustained.
The radar image is assembled from multiple radar sources stitched together, so coverage may vary by area. If you notice any gaps, switch to the Outlook page where the Regional Satellite Animations, Forecast Images and Rain Tracking provide additional insight.
Scale & coordinates
The scale bar below the zoom buttons shows distances in km and miles. Moving your pointer over the map displays the cursor's latitude and longitude. Degree labels along the edges adjust as you zoom — from 5° down to 0.1° — to help align positions.
Wind radii
Amber circles show the radius of tropical-storm-force winds; red circles mark hurricane-force winds. These illustrate the maximum extent from the storm's centre. Forecast updates may adjust their size.
Tropical waves
A short dashed teal line marks the axis of a tropical wave as placed in the NHC Tropical Weather Discussion, drawn over the latitude range NHC states, the way the surface analysis shows it. Hover the line or its label for NHC's own description and the time of the analysis. The line is not a forecast and says nothing about rain; the precipitation overlay does that. Waves already tracked as a numbered disturbance are shown by their disturbance marker instead.
Beyond storm tracking
This map uses an OpenStreetMap base layer that includes hospitals, fire stations, helipads, shelters, bus routes, building names, and hilltop elevation markers. These are details that matter during hurricane preparedness and emergencies. Use it to familiarise yourself with nearby high ground, medical facilities, and potential shelter locations before storm season begins.
Update schedule
Storm positions and island weather observations are updated eight times daily (02:00, 05:00, 08:00, 11:00, 14:00, 17:00, 20:00 and 23:00 AST). The 1hr rain overlay refreshes hourly with the latest satellite data. Use alongside official forecasts from the NHC and your local meteorological service.
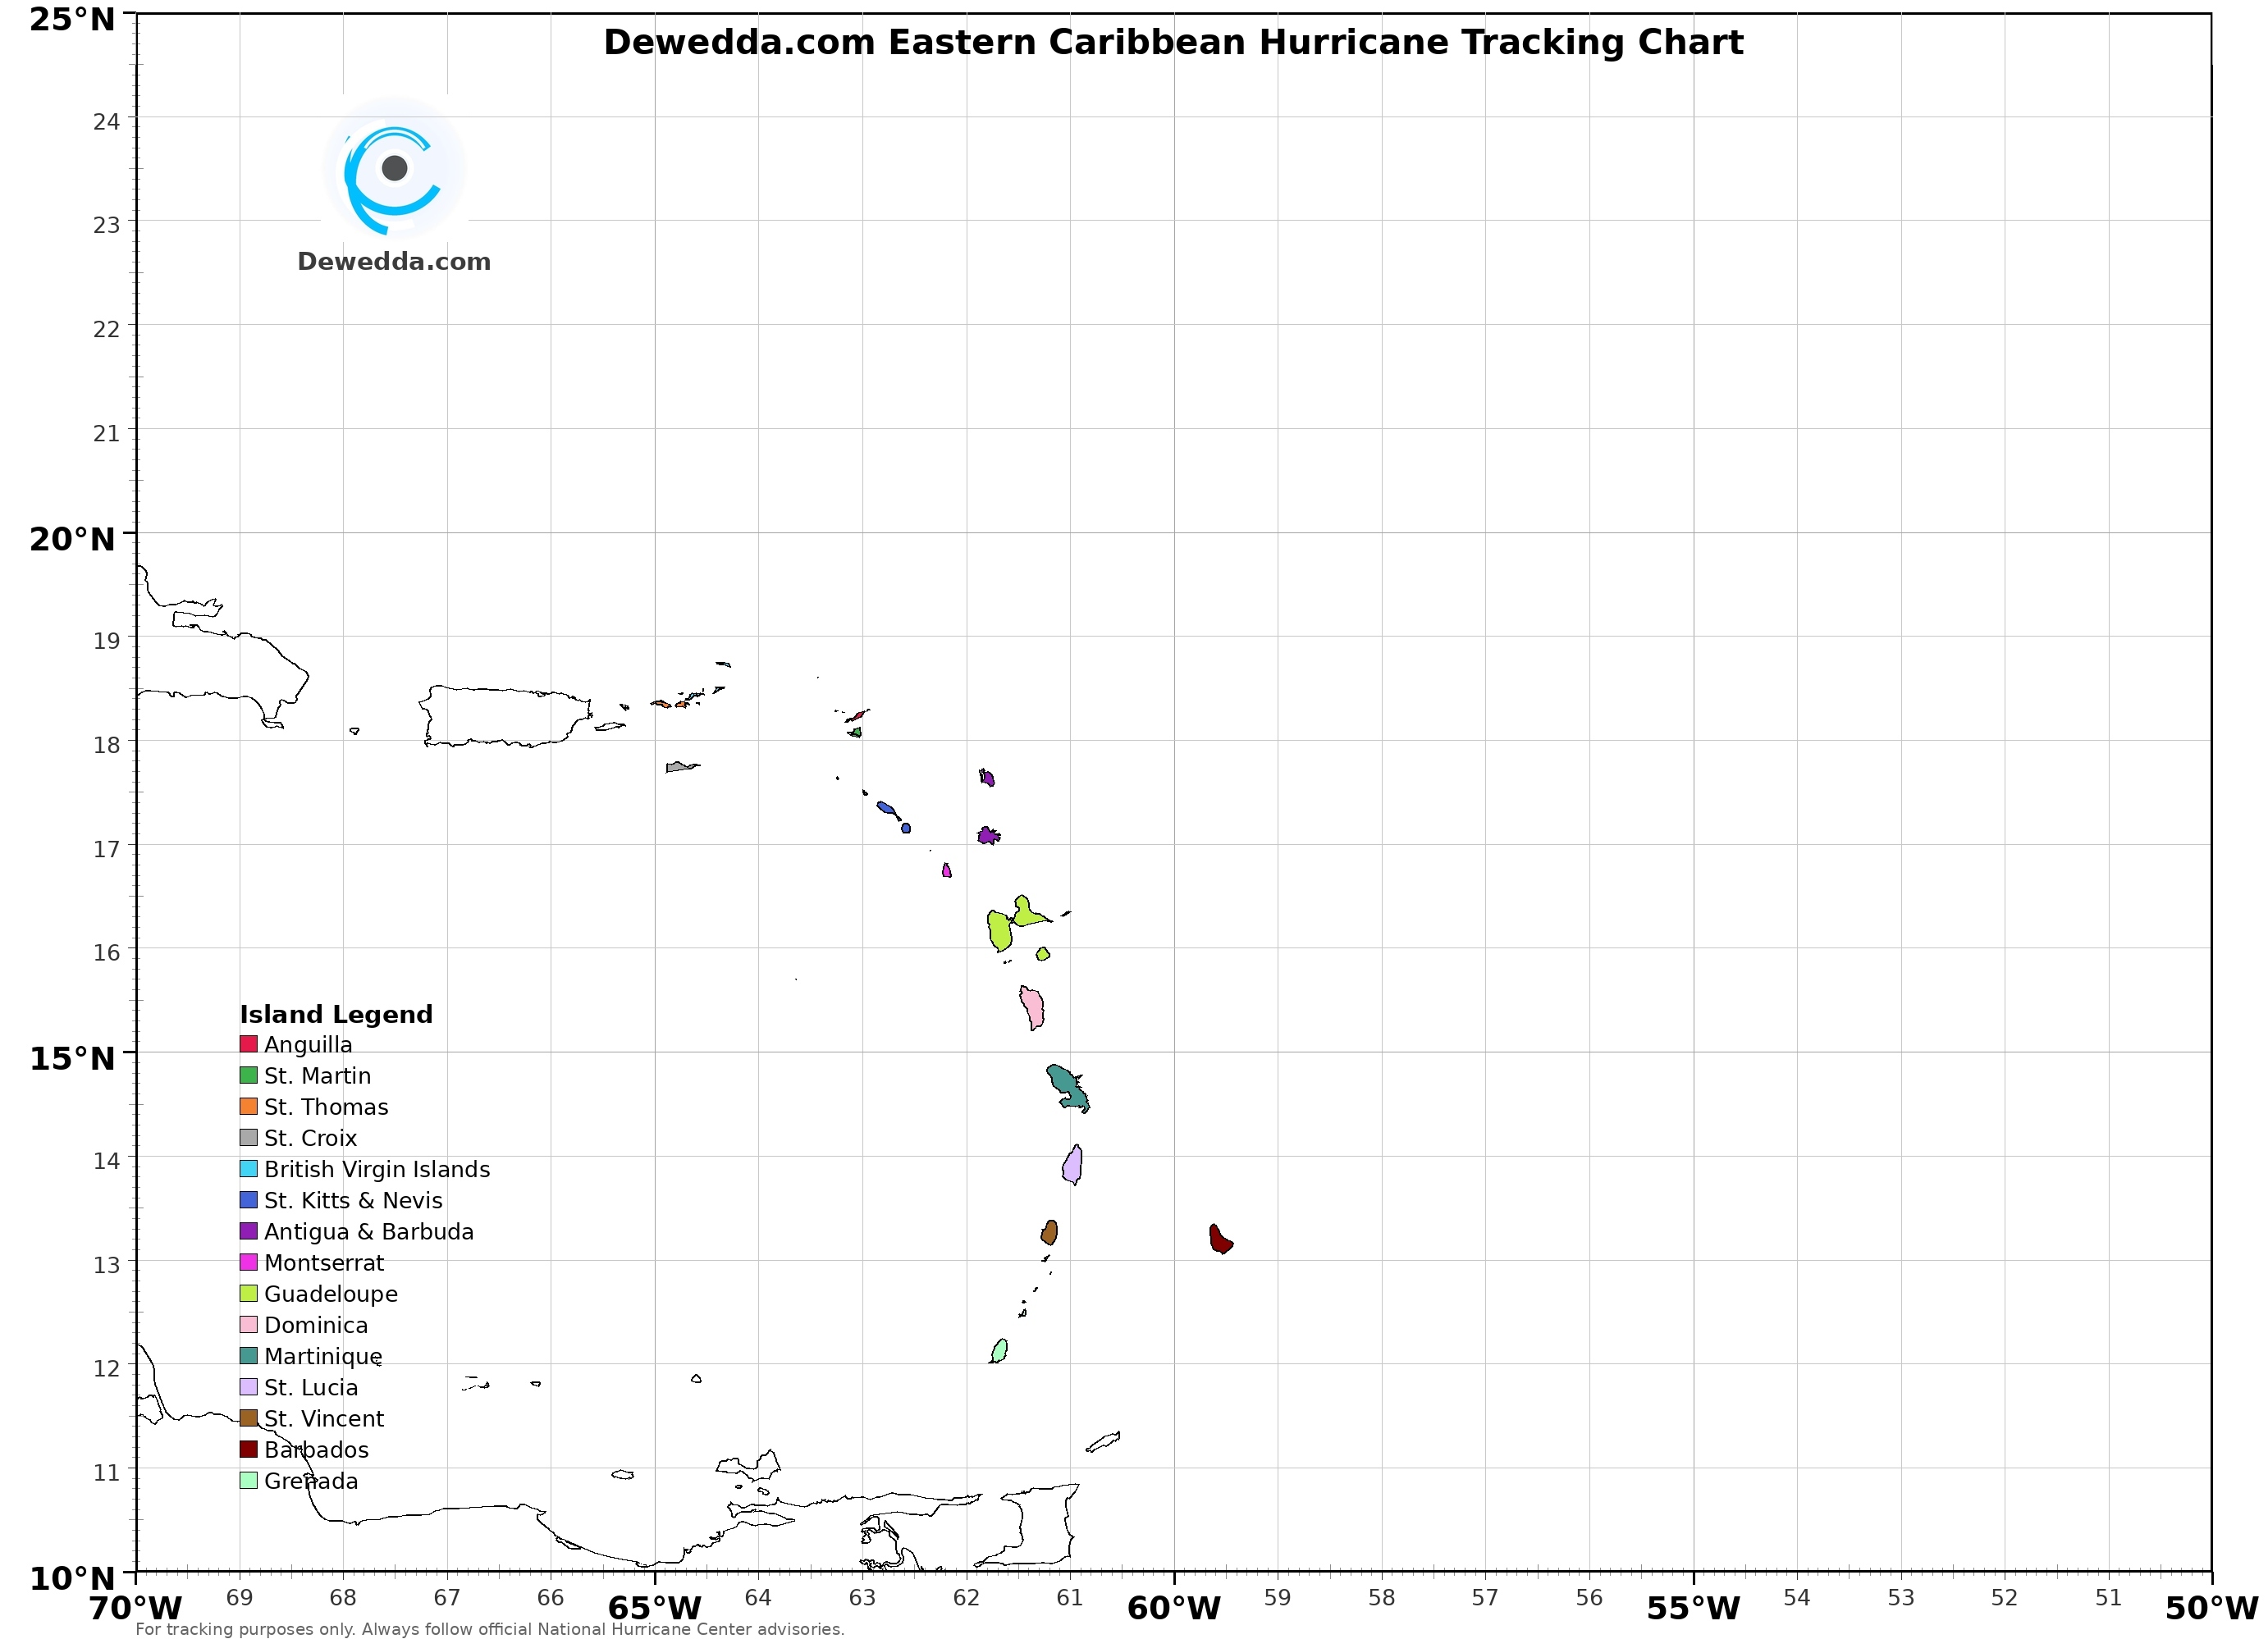
Hurricane Tracking Chart
This printable tracking chart is designed specifically for the Eastern Caribbean, with each island colour-coded and labelled so you can plot a storm's position as advisories are issued. The grid covers 10°N–25°N and 50°W–70°W — the approach zone where tropical systems most directly threaten the Leeward and Windward Islands.
Print it out at the start of hurricane season and keep it handy. As the NHC issues coordinates, mark each position on the chart to visualise the storm's track relative to your island.